Thursday 31 January 2019

One Million Affordable Homes by 2029?


The short answer is “Tall Order” or “Fat Chance”! The previous Government only met 20% of its target. But the new Government has an election manifesto target of one million affordable homes within 10 years. So it aims to build 100,000 units a year beginning 2019.

For quality housing with facilities, connectivity and a minimum of 850 sq.ft. in space, it is difficult for prices to be below RM280,000 in the Klang Valley. Why?

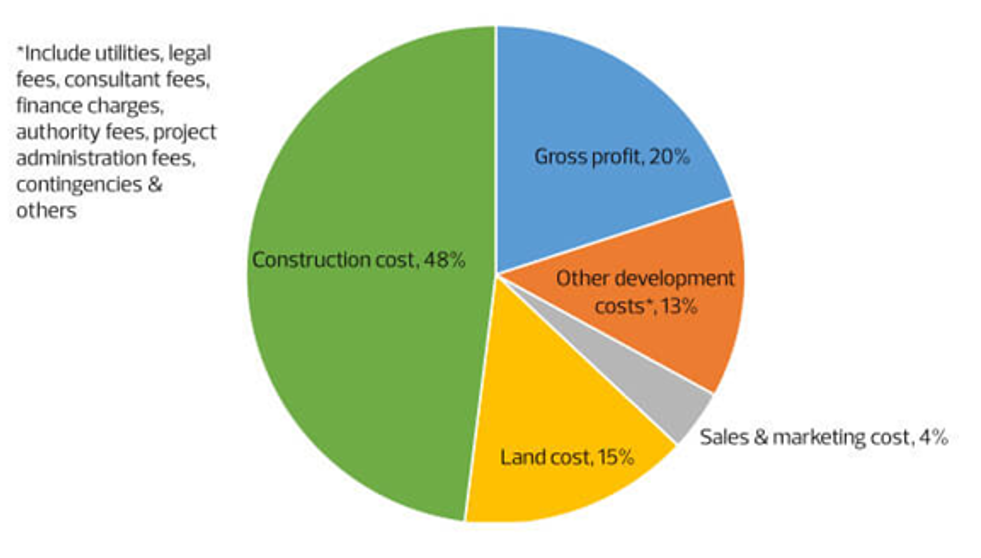
Construction cost alone accounts for 48% of total costs. Land cost is roughly 15%, soft costs about 13% and the balance of 24% for sales, marketing and gross profit.

There are constraints to lowering the cost of houses


So lowering land cost (15%) has only a small effect on selling prices. And it is difficult to build high-rises below RM130 psf.

Then the next solution is to loosen financing and allow people to borrow more or lengthen their mortgages. Lowering credit risk requirements is irresponsible. Lengthening period may help to a degree. Then there is speculative activity. Nevertheless total household debt has expanded from 48.5% of GDP in 2000 to 84.3% in 2017.

So that leaves prospective owners with little solution but to rent.

To overcome bankers’ reticence, one may consider a National Housing Loan Corporation focused on financing developers in good locations and providing end-financing of up to 50 years, on subsidized interest rates of 3-4% p.a. Unless, income levels improve substantially it is difficult for the average prospective buyer to purchase a house unless Government intervenes with a national scheme.
References:
1.         Special Report: The State of Housing in Malaysia, Tong Kooi Ong, The Edge Markets (2 October 2018)
2.         One Million Affordable Homes a “Tall Order” for Malaysia, Syahirah Syed Jaafar, The Edge Financial Daily

Wednesday 30 January 2019

Economic Powerhouses in 2030


In just over a decade from now the largest economies are most likely to be different. China will dominate the world, followed by India and the U.S. A Standard Chartered report suggests 7 of the 10 largest economies in 2030 will be from emerging markets.

Asia’s share of global GDP will rise from 28% to 35% by 2030 and will match Europe and U.S. combined. Around 5.4 billion people will form the middle class, up from 3 billion in 2015.

China’s GDP will hit USD64.2 trillion and moderate to 5% growth by 2030. India is expected to accelerate to 7.8% growth and reach a GDP of USD46.3 trillion by 2030. The U.S. will be a USD31 trillion economy. Indonesia will rise to be 4th largest economy in the world with GDP at USD10.1 trillion in 2030. It is probably 3 times the size of Australia. Others that will rise include Turkey (USD9.1 trillion), Brazil (USD8.6 trillion) and Egypt (USD8.2 trillion). Russia, Japan and Germany will drop places but remain fairly large.

What is the implication? Businesses and prospective trade arrangements will have to pay closer attention to those rising economies which may dominate and dictate the future. Long-term planners in corporates or banks will see the need to have some representation or association in those nations that are expected to rise over the next decade. Otherwise, they miss great opportunities.

Reference:
The World’s Economic Powerhouses Are Going To Look Very Different In Another Decade, https://www.news.com.au


Tuesday 29 January 2019

A Brexiteer’s Fantasy : “The Singapore Model”


Tara John of CNN (Jan 27, 2019) reported the idea that may have gained traction among some Brexiteers, i.e. the “Singapore Model” – low tax, low regulation and low public spending. Boris Johnson, Michael Gove and others feel Britain can draw encouragement from the Singapore Model.

At face value, it looks exciting. But is Britain’s welfare system, where Government accounts for 40-45% of GDP, be transformed into just 16-17% of GDP? It is also not just the tax rate (of 22%) in Singapore to U.K.’s 45% tax for the top tax earners, but a raft of attractive things as observed by Sudhir Thomas Vadaketh, a Singaporean author/economist. Singapore is on a major shipping route, stability in a sea of uncertainty and has an educated and hard working population. Then there is easy access for migrants with skills. Immigration was (and is) a major issue for Brexiteers. And the other cost is human rights and free speech with a benevolent interventionist government. Will Britain do that?

The good point for Singapore is that it is ever willing to change policies for business and look forward to being a technological centre in the region. To be a “Singapore of the West”, Britain needs a fundamental shift in the following:

·       Discard the welfare system;
·       Have an interventionist government;
·       Create an environment for application research;
·       Have migrants with skills;
·       Reduce size of government to GDP;
·       Respond quickly to commercial interests and market place economics; and
·       Rely on a lower tax regime to fund public sector finances.

Is “Great” Britain willing to change its greatness?


Monday 28 January 2019

South Korea Leads The World on Innovation


The annual Bloomberg Innovation Index analyses dozens of criteria using seven metrics, including research and development spending, manufacturing capability and concentration of high-tech public companies. South Korea retained the global crown in the 2019 Bloomberg Innovation Index, though improvements by Germany in research and education brought Europe’s largest economy to near-parity in the annual ranking. Although South Korea extended its winning streak, its lead narrowed in part because of lower scores in patent activity.

The US moved up to eighth place, a year after cracks in education scores pushed it out of the top 10 for the first time.


Sweden, the runner-up in 2018, fell to the seventh spot. Patent activity boosted the scores for China (16th) and Israel, which was a big winner by jumping five spots to fifth overall.
South Korea’s staying power at No 1 should receive a boost from fresh investments in strategic technologies and a regulatory program that encourages start-ups, according to Khoon Goh, head of research at Australia & New Zealand Banking Group in Singapore.  “Innovation is becoming increasingly important to drive economic performance, particularly in the higher-income Asian economies where there is no longer a demographic dividend and higher value-added manufacturing assembly is being shifted to lower-cost countries in the region,” Goh said.
Also among the new entrants are some of the world’s largest emerging economies: India, Mexico, Vietnam and Saudi Arabia.

What about Malaysia? We remained 26th for 2019, no change from the previous year.


Reference:
Germany nearly catches S. Korea as innovation champ, US rebounds, Bloomberg, 22 January 2019

Friday 25 January 2019

Using Fourier Transform to Determine Market Cycles


Fourier Transform is one of the most important tools in the modern signal processing world.  It is widely used in communications, geology, acoustic and engineering field.  However, its capability to decompose time series data into frequency domain has extended its usage to other fields such as finance and business (Read more here).

In finance, moving average is a common indicator to track the movement of the stock market.  However, the period of the moving average indicator is normally selected at the discretion of the users, which sometimes may not be appropriate.  Fourier Transform is a good tool to determine the period for the moving average.  The following graph shows the significant period of the KLCI daily closing price determined by Fourier Transform.


From the graph, short term significant periods are 8 and 17 days while medium term significant periods are 28, 43, and 61 days.  Fourier Transform computations could be found in popular engineering software such as MATLAB or common financial tool such as Excel Analysis ToolPak (Read more here).

Thursday 24 January 2019

Do Malaysians Love Cashless Payments?


According a report by Focus Malaysia, 67% of Malaysians use some form of cashless payments – debit cards and online banking. This is based on a study released by Nielsen Malaysia.

The report suggests 63% of Malaysians use debit cards and 57% use online banking to make payment. Only 27% use credit cards to pay for their expenses. Mobile wallet is the least at 8%.

For regular or recurring expenses it is online banking. And this is for phone and internet bills (53%), utility bills (47%), car loan instalments (38%) and rent (37%).

Cash is preferred for dining out (93%), groceries (90%) and petrol purchase (81%). Awareness of mobile wallets (88%) is high but not usage. Why? Security concerns – risk of fraud is the biggest barrier. Another is danger of overspending. So this is an area for mobile wallet providers to work on and create an environment of its safety.

Unlike Malaysia or U.S., Chinese consumers have adopted cashless and e-commerce methods faster. Around 68% of internet users (who constitute more than 731 million) use mobile digital payments compared to the U.S. (about 15%). It is estimated that 61% of global mobile payments in 2018 was from China (primarily through AliPay and WeChat Pay).

References:
1.         Two in Three Malaysians Use Cashless Payments, Focus Malaysia (17 Jan 2019).
2.         Why China Leads the World in Mobile Payments, Sharon Rosa-Bohrer


What is your preferred cashless payment method?
 
pollcode.com free polls


Wednesday 23 January 2019

Will Malaysia Be A High Income Nation by 2020?


The short answer is No! With GDP expanding at 4% to 5% (at best) for this year and next, per capita income will fall short of a high income nation.

The Government’s estimate for per capita income in 2020 is USD11,700. The threshold by the World Bank is USD12,235. So much for transformation programmes under Pemandu. A key weakness of the Malaysian economy is the low R&D level. Israel and South Korea spend 4% of their GDP. Japan, Finland, Austria, Sweden, Switzerland and Denmark spend more than 3%. And Malaysia spends 1.3% of its GDP. If it is 4% of GDP, then we need to allocate USD14 billion for R&D. And that could be in sectors we have a comparative advantage i.e. resource based industries.

So when can we be a high-income nation? Probably 2024 and that depends on a whole gamut of factors.

What about being a fully developed country? Well, that takes a lot more effort – including meritocracy, being ethical, inclusive, just, progressive, caring and competitive. We are not there yet – maybe high-income and progressive reduction in inequality is a more achievable target for now.

References:
1. Cover Story: Two years to 2020: High-income or developed nation? Edge Weekly, Kamarul Azhar/The Edge Malaysia, January 11, 2018.
2. Malaysia to achieve high-income status by 2024, P Prem Kumar & Alifah Zainuddin, Malaysian Reserve.


Pic source: World Of Buzz

Tuesday 22 January 2019

British Royals: What Do They Cost?


Royalists often point out that they cost around £1 per year per person. This excludes security cost of looking after the family. But a republican pressure group estimates that the public cost of the monarchy is closer to £350 million. This is funding for official duties – opening ceremonies, chairing charities, hosting garden parties, travelling and others. That may total 3,000 or more engagements.

The Queen, Prince Charles and others have private incomes from private landed estates and financial assets. The Queen earned £19.1 million in 2016-17 from a landed estate called the Duchy of Lancaster. Prince Charles had a revenue of £22.5m (2016/17) from the Duchy of Cornwall. Do they pay taxes? Queen voluntarily paid income and capital gains tax since 1992. Prince Charles paid tax of £4.76m.

So what are the financial benefits?

Visit Britain estimates tourism linked to royal residences made up 2.7 million visitors a year. Brand Finance, a consultancy, estimated their contribution to be about £1.8 billion a year. But if we put this in context, overseas visitors spent £22.5b in U.K. in 2016. And U.K. exports totalled £543 billion. In that sense, it is not that significant. However, if we are to view the Royal family from a political, moral, aesthetic one then the financial question is superceded.

References
1.         British royals by the numbers: what they cost (and bring in)
            (https://www.fastcompany.com)
2.         Does Royal Family really make financial sense for the UK economy?
            (https://www.independent.co.uk)


Friday 18 January 2019

“Recession” or “Rebound”?


In a previous article, we demonstrated the stock market movement prediction using Google Trend search term (Read more here).  This week we are going to use the Google Trend to study the stock market direction using a different search term.

In the following graph, the search term “Recession” frequency and the MSCI World Index were plotted together from 2004 to 2018.  The frequency of the search term is plotted in orange while the blue curve is the MSCI World Equity Index.

Coincidently, two significant peaks of the search term frequency (red circle) occurred at the reversal of the market down trend.  This suggests that market might rebound when the sentiment is very negative.  So, our next question is whether the current “recession” sentiment has reached its peak?  Google Trend might have the answer perhaps?


Thursday 17 January 2019

Future Returns and Stock Market Valuations


One may observe the following three factors contribute to future market returns:

(i)         future business growth;
(ii)        dividends; and
(iii)       change in market valuations

The total projected market returns for all three components for developed and emerging markets is shown below:

                                                Projected Annualized Market Return (%)


For emerging markets, contribution from economic growth is higher than in more developed markets.

Over the past 100 years, equity investors have managed to generate real capital growth of about 7 per cent annually. No other investment – bonds, cash, gold or real estate – offers comparable return potential. But does it pay to invest in equities at this point in time and what can what can investors expect in the long-term? Academic research has shown that undervalued equity markets have achieved higher future returns in the long-run than their counterparts. Shiller’s CAPE suggests the following:

            World              CAPE
            -Developed     22.9
            -Emerging       14.9

Warren Buffett believes the percentage of total market cap relative to GNP is “probably the best single measure of where valuations stand at any given moment”.

Reference
Global Stock Market Valuations and Expected Future Returns (https://www.gurufocus.com)

Wednesday 16 January 2019

Cost of Trump’s “Vanity” Wall


The Trump administration wants to enforce a wall on the 1,933 mile border between the United States and Mexico. Under Bill Clinton a 14 mile wall was constructed. Then, President George W. Bush built another 654 miles of physical barriers (wall and fences). About 130 miles of the border has natural barriers, so that leaves about 1,135 miles left to cover.

Many different cost estimates have been thrown around:


President Trump
Paul Ryan (former Speaker)
Homeland Security
Washington Post
Senate Democrats’ Report
USD billion
12
15
22
25
70

As a U.S. statistician worked out, the physical cost of the wall could actually be in the region of USD25 billion. And over 12 million people who live 100 miles of the border will be impacted in very significant ways. A wall also will not help to stem drug trafficking. Over 95% of drugs entering the U.S. is through container ships or other vessels.

And will Mexicans pay for it? Remittances from the U.S. by Mexican families amount to USD20-25 billion annually. But this cannot be seized. It has devastating effects on both U.S. and Mexico. The remittances reduce the incentive for further immigration to the U.S. – precisely what Trump wants to do! The real question the American public should be asking is not how much the wall is going to cost but what is the best way to secure U.S. borders from illegal activity like human and drug trafficking.

References
1.         Trump’s Border Wall – how much it will actually cost according to a statistician
            (https://www.foxnews.com)
2.         The Wall, Vanda Felbab-Brown, August 2017
            (https://www.brookings.edu)
3.         https://www.bbc.com/news/world-us-canada-46805568

Tuesday 15 January 2019

Economic Impact of May’s Deal and a “No Deal” Scenario


On January 15, the British Parliament will vote on Theresa May’s Brexit deal. Most MPs seem to see a clear defeat for Theresa’s motion. But what is the economic impact?

The LSE Centre for Economic Performance in association with “The UK in a  Challenging Europe” has modelled both scenarios (“Theresa’s Deal” and “No Deal”) and examined the consequences. The modelling suggests that the current Brexit deal could reduce UK’s GDP per capita by between 1.9% and 5.5% in 10 years time compared to a remain option. In a “No Deal” scenario, UK’s GDP per capita is reduced by 3.5% to 8.7% compared to the baseline of remaining as an EU member.

The IMF has forecast a scenario in which a “No Deal” Scenario and a “Remain” Scenario will show a drop of about 6%. The UK Treasury’s modelling suggests the UK GDP will decline by 2– 4% over next 15 years. In a no-deal Brexit, the UK economy could shrink by 9.3%.

Consequences of this (Brexit), is the cost to public finance, domestic consumption, and decline in private investment. Leading Brexiters are unwilling to discuss what price is worth paying in order that UK leave the EU. It is fine to say economics is not the most important consideration. But what is not acceptable is to deny that there will be any damage at all.


Monday 14 January 2019

Financing Option Focus

A major bank is looking for clients involved in smart technology, automation, robotics and artificial intelligence. A fund of RM3 billion is available at a subsidised interest rate of 2% p.a.

Also, if a company is involved in sustainable development (renewable energy and the like) another fund of RM1 billion is available at a subsidised interest rate of 2% p.a.

If you are interested in the above opportunities or would like to offer your hot deals, please contact info@mpcap.com.my or 603 - 2283 1170 for further details!


Friday 11 January 2019

Asset Class Performance in 2018


Wondering you have chosen the correct investment in 2018?  The following graph shows the various asset class performance in 2018.  2017 market’s darlings such as cryptocurrency and oil were the biggest losers in 2018.  Bitcoin and Oil dropped more than 70% and 25% in 2018 respectively.  Hang Seng dropped 14% while S&P500 and KLCI dropped 6.2% and 5.9% respectively.  Gold lovers were not amused with their collection as their return was at negative 1.7%.  The safe haven was fixed deposit which yielded 3.5%.

In a previous article on P2P lending investment (Read more here), we featured the return could be at an average of 10%.  The author has experimentally invested in the P2P platform and gained 12.59% in 2018.  This shows that it is always good to diversify your portfolio in some alternative investments.

If you are interested to invest in P2P lending, you could sign up using the following link


Disclosure: The author will receive a one-time referral fee of RM50 for each new investor who signs-up via the above link AND invest at least RM1,000 (Read more here).


Thursday 10 January 2019

Is STEM Education Important?


According to the U.S. Department of Commerce, STEM (Science, Technology, Engineering and Mathematics) occupations are growing at 17% annually in the U.S. All other occupations are growing at 9.8%. STEM degree holders have higher income than non-STEM holders. STEM education creates critical thinkers, increases science literacy and generates the next generation of innovators. But the reality in the U.S. is that scores on average for mathematics and science are lagging behind other developing countries.

A curriculum that is STEM-based has real-life situations to help students learn. STEM activities provide hands-on and minds-on lessons for students. Making maths and science fun and interesting will help students not only learn but create a passion for it. It breaks gender, ethnic, racial or income gaps for a global economy.

What about Malaysia? The anticipation is one million new STEM careers in Malaysia by 2020. According to Kelly Services, fresh STEM graduates could expect salaries of RM3,900 and above as automation engineer or Java developer (RM5,200). But the reality is the enrolment of students in science stream (Form 5) has seen a steady drop of 6,000 (on average) per year since 2012. Enrolment now is 167,962 out of a total of 375,794, or about 45%. The real worry is that the highest unemployment among all graduates in the country are those from the science and technical courses at 20.7%.

 Will MITI, Education Ministry and the private sector work on ideas to fulfil Malaysia’s ambition of Industry 4.0?

Reference
Star Online, Sunday 21 October 2018 and others


Wednesday 9 January 2019

Did Britain Steal USD45 Trillion from India to be “Great”?

Britain ruled India for about 200 years, a period marred by poverty and famine in India. The commonly told story in Britain is that the colonisation of India was not of any major economic benefit to Britain – much like joining the EU in 1973. The fact that the empire was sustained for so long was a gesture of Britain’s benevolence!

Utsa Patnaik, an economist, dealt a crushing blow to the above narrative. Patnaik calculated that Britain had actually drained nearly USD45 trillion during the period 1765 to 1938. That’s 17 times the GDP of the U.K. today.

It was a scam – theft on a grand scale, that puts 1MDB’s shenanigans as “loose” change. Indian taxes was used to purchase Indian goods for Britain and/or for re-export elsewhere. That is the basis of financing Britain’s Industrial Revolution. On top of this, Britain was able to sell to India finished products with India having no option of securing cheaper alternatives. So India was in debt to their colonial overlords. That is control.

In a 2014 poll, about 50% of the people in Britain believed colonialism was beneficial to the colonies. Yet over 200 years there was almost no increase in per capita income in India. In fact, millions died because of policy induced famine.

So what must Britain do today, other than Brexit? An apology? Reparations? Changing the narrative? I could say all of the above but reparations is the last thing “poor” Britain could forward. Perhaps, do as Shashi Tharoor suggests pay £1 annually to India for the next 200 years and issue a public apology for the misdeeds!

References:
1. How much money did Britain take away from India, Business today
2. How Britain stole $45 trillion from India, Jason Hickel


Tuesday 8 January 2019

Is the U.S. Abandoning Its Services Economy?


According to Anne Krueger, a former World Bank chief economist, the U.S. under Trump is playing on its weakness rather than from its strength.

In the 19th century, 70% of American workers were in the farming sector. In 2017, it was only 2%. In 1970, 32% of private employment was in goods producing industries. The figure in 2018 was 13.5%. The dynamic sector of the U.S. economy is services – not house cleaners or maintenance crews but transportation, IT, finance, professional and business services, education, entertainment and many more. Of all private sector employment, 70% is in services. So you have the likes of Google, Microsoft, Oracle, Disney, 20th Century Fox, Amazon, McKinsey and many more.

With affluence, people spend more on travel, entertainment, education, healthcare and others. The U.S. leads the world in many services. In 2017, America’s export of services was USD798 billion while imports was USD542 billion. And services exports have been growing rapidly compared to exports of goods.

As technology accelerates, it is the services sector that will provide future employment not coal, steel or farming. Trump has no grasp of this, as he reads little and follows “Fox News” for ideas! That is the self-proclaimed genius of a President! And America will pay a heavy price if the President prevails with his silly obsession, i.e. trade balance!

Reference:
Trump’s Anti-Service Economy, Anne O Krueger


Monday 7 January 2019

Insight Deals - Proposed Solar Plant (upto 50MW) in North Peninsular Malaysia


We are in the midst of organising a proposed solar project with the following key ingredients:

·       Up to 50MW
·       Project cost of around RM200 mil – 250 mil; and
·       Land area of up to 150 acres, flat and unhindered access to sunlight (land has been identified).


We are looking for interested parties who wish to invest/ sponsor the Project, upon a tender exercise by the Government.

If you are interested in the above opportunities or would like to offer your hot deals, please contact info@mpcap.com.my or 603 - 2283 1170 for further details!


Friday 4 January 2019

Logit vs Probit


In a previous article, we illustrated the usage of logit model to predict the potential PTPTN defaulters (Read more here).  One could use the probit model to run the analysis as well.  In the logit model the log odds of the outcome is modelled as a linear combination of the predictor variables.  Meanwhile, in the probit model, the inverse standard normal distribution of the probability is modelled as a linear combination of the predictors.

The following chart shows the comparison between logit and probit results.  Both models gave similar results, with logit model giving slightly “fatter” tails.  The capability of their predicting power is the same for both models.


The choice between logit and probit model is purely personal.  But it is always good to have an alternative model to cross check the results.  They are used in various fields, including machine learning.  Logit is more popular in medical fields and social sciences while probit is often used in advanced econometric, finance and political sciences.

Thursday 3 January 2019

Are You the New CEO in a New Year?


The New Year may see many large or small organisations led by new CEOs. In the U.S., one-third of all CEOs chosen to guide companies are gone within three years of appointment. Getting a good start is essential and much has been written regarding the first 100 days.

McKinsey’s Kevin P. Coyne and Bobby S. Y. Rao interviewed 15 current and former CEOs of U.S. companies about choices and lost opportunities. These CEOs led companies with annual sales of USD1 billion to more than USD25 billion. What Coyne and Rao gleaned include:

(i)        Seize the day – the period between designation and ascension is critical to make the difference;

(ii)       Attack areas of weakness – overcome personal areas of weakness through re-training, consultation with industry experts, hire a private coach or simply follow the retiring CEO on a tour of field operations;

(iii)      Know the Board – each member of the Board is important and a personal touch and understanding them early is useful;

(iv)       Have a narrative before Day One – people may be impatient to know your long-term strategy for the company on the first day of work! Project confidence that the new leadership can address issues;

(v)        Get help for unpleasant tasks – policy changes, removing problem executives could be unpleasant and getting independent outside help is useful;

(vi)       Find a confidant – external business associates, a Board member or a professional coach could fill that role; and

(vii)      Beware of civic duties – many “new” causes of a social or community nature may arise – but postpone any  commitment until you get your bearings right.

What about job focus? Well it depends on the circumstances but these five were listed by Roger L. Martin:

(i)         Revenue Growth – grow the revenue pie;

(ii)        Follow processes/procedures;

(iii)       Consult your team where necessary;

(iv)       Set high strategy standards; and

(v)        Encourage diversity – people with different backgrounds, qualifications, experience add value to the company. Monoculture or a one race mentality is usually a recipe for disaster!

So if you are called to lead an organisation and find yourself thrust into a hugely challenging role, remember you don’t have to be the one in three failures! Good Luck!


References:
1.  A Guide for the CEO-elect, Kevin P. Coyne and Bobby S. Y. Rao, McKinsey Quarterly (Aug 2005)
2.  The Five Rules Every New CEO Should Follow, Roger L. Martin, Harvard Business Review